
Sugar Consumption
channel: data visualization“Added sugars, especially from sugar-sweetened beverages, are strongly linked to the development of Type 2 Diabetes. This is likely due to sugar’s direct effect on your liver, as well as its indirect effect of increasing body weight.”
- Erica Julson, MS, RDN, CLT
Project Brief -
Collect a data set that interests you and create an engaging and immersive experience that displays multiple variables at once.
Deliverables -
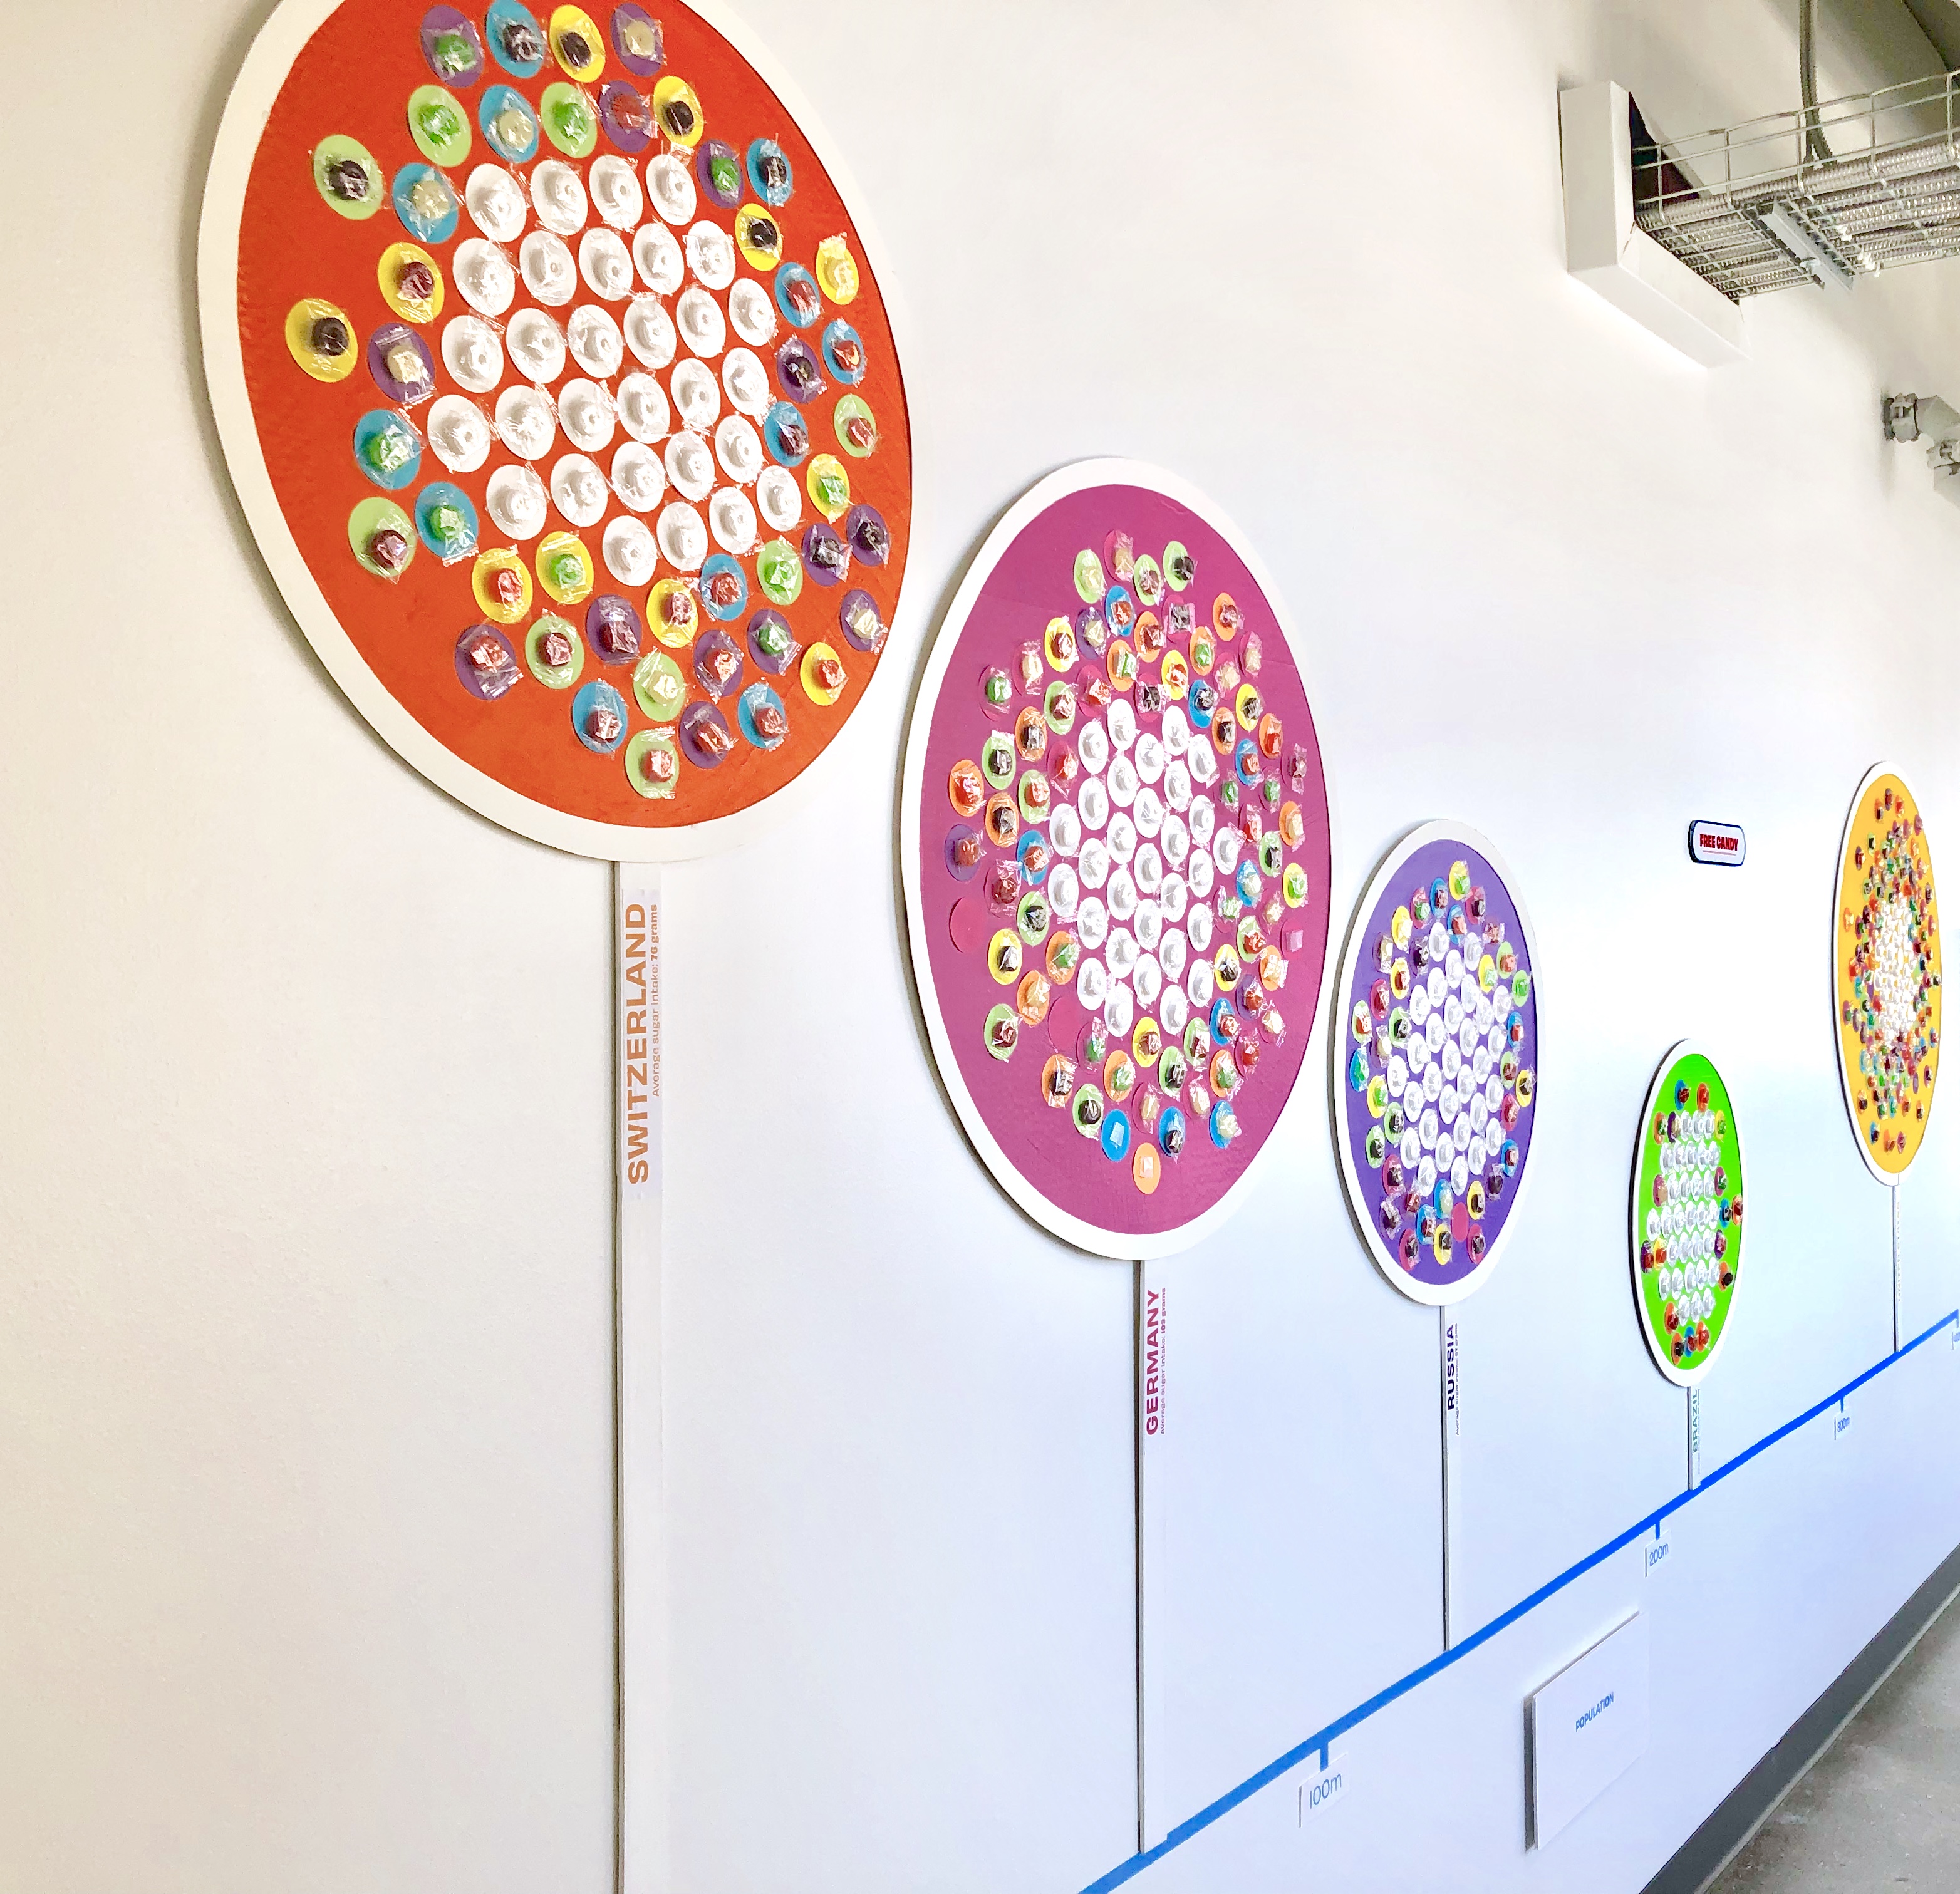
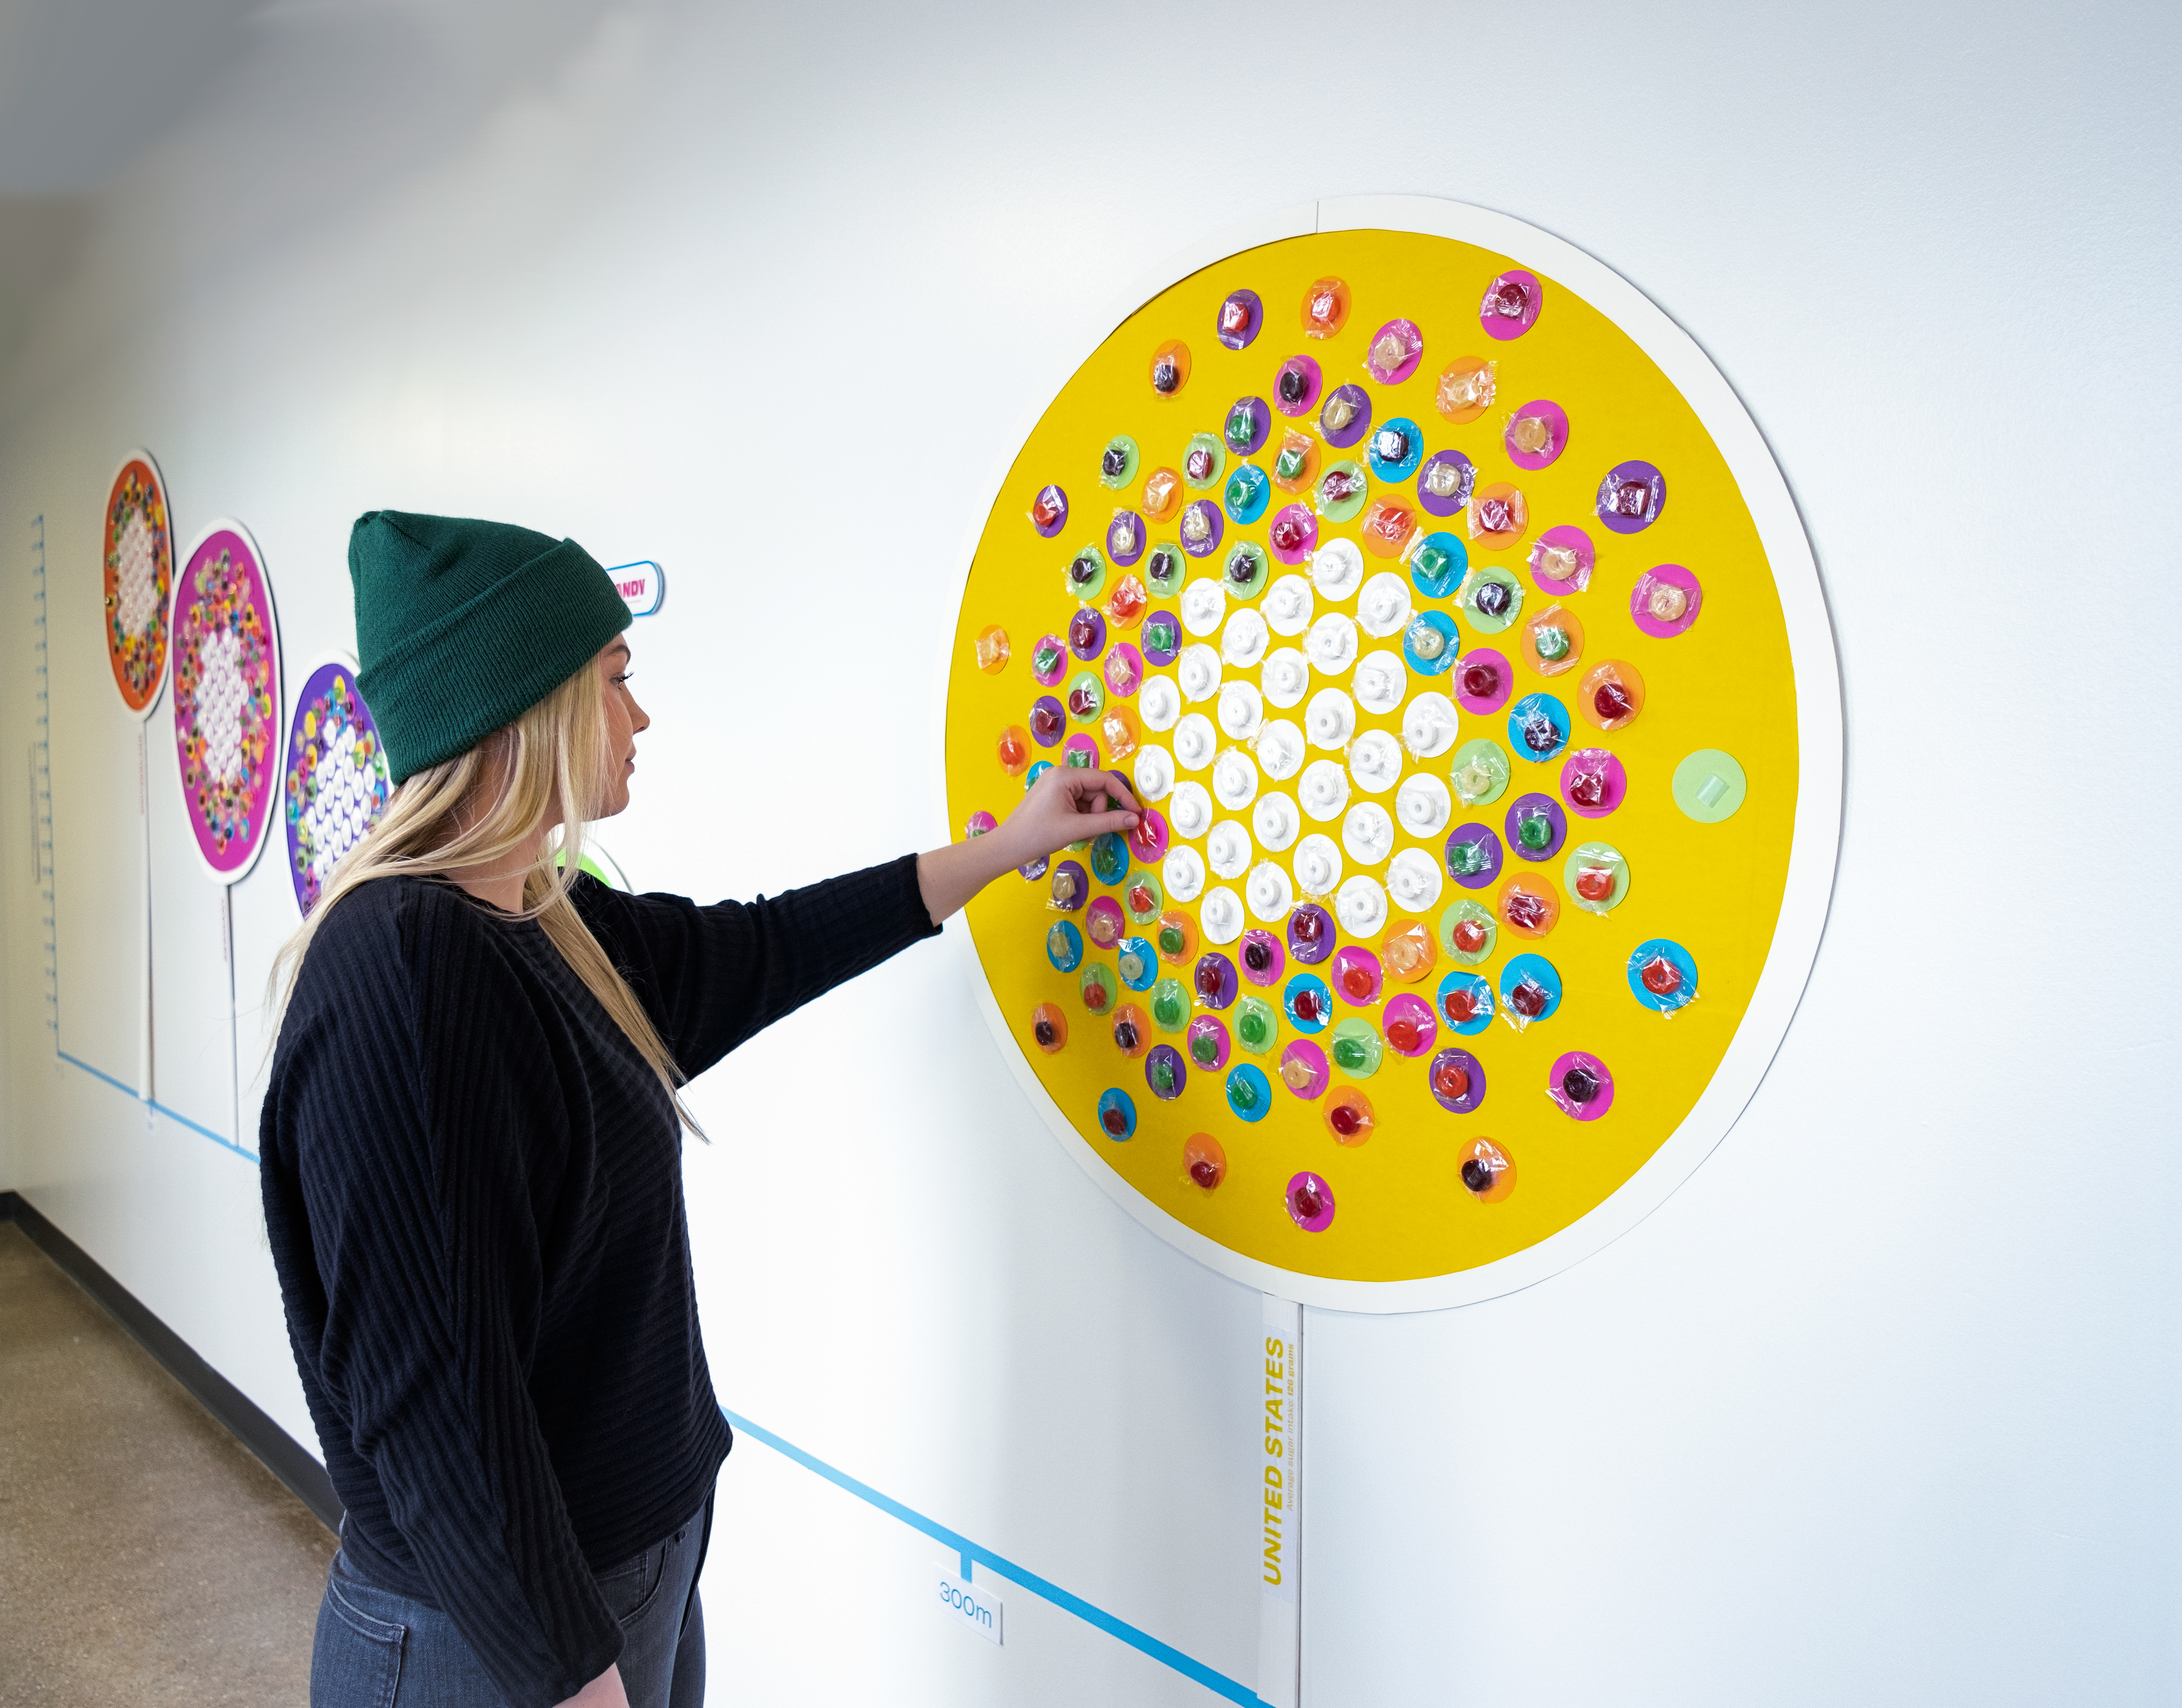
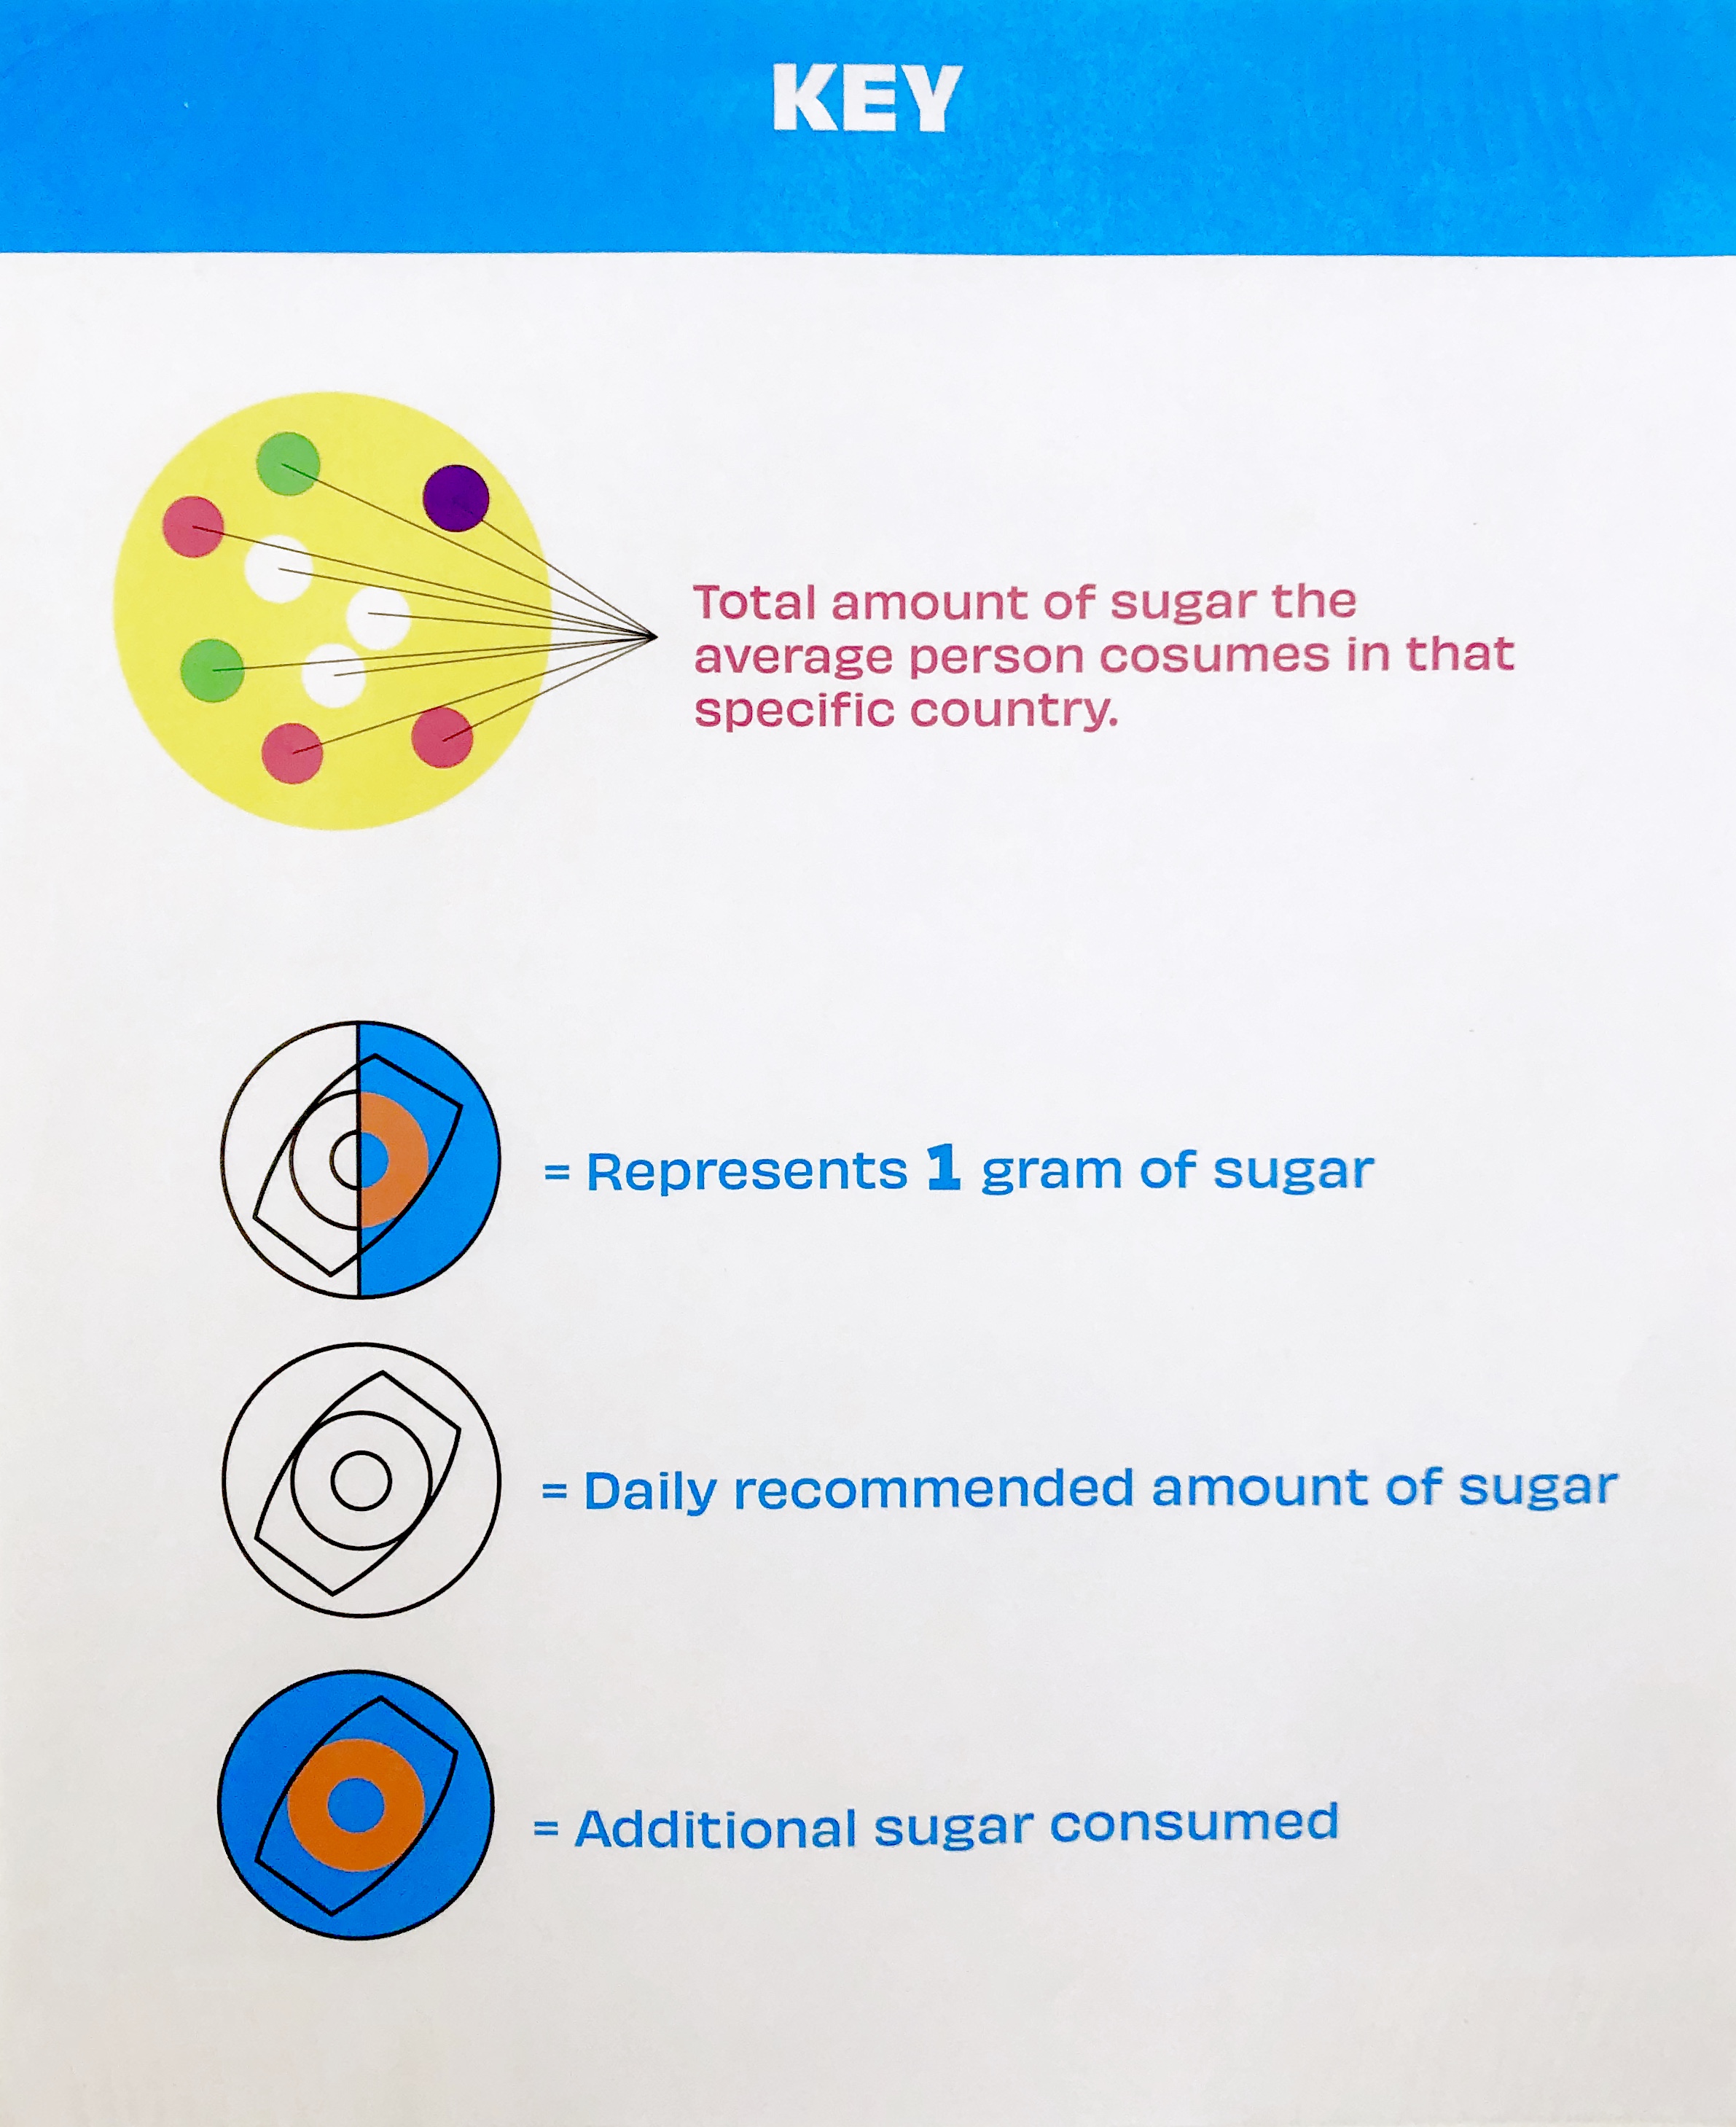
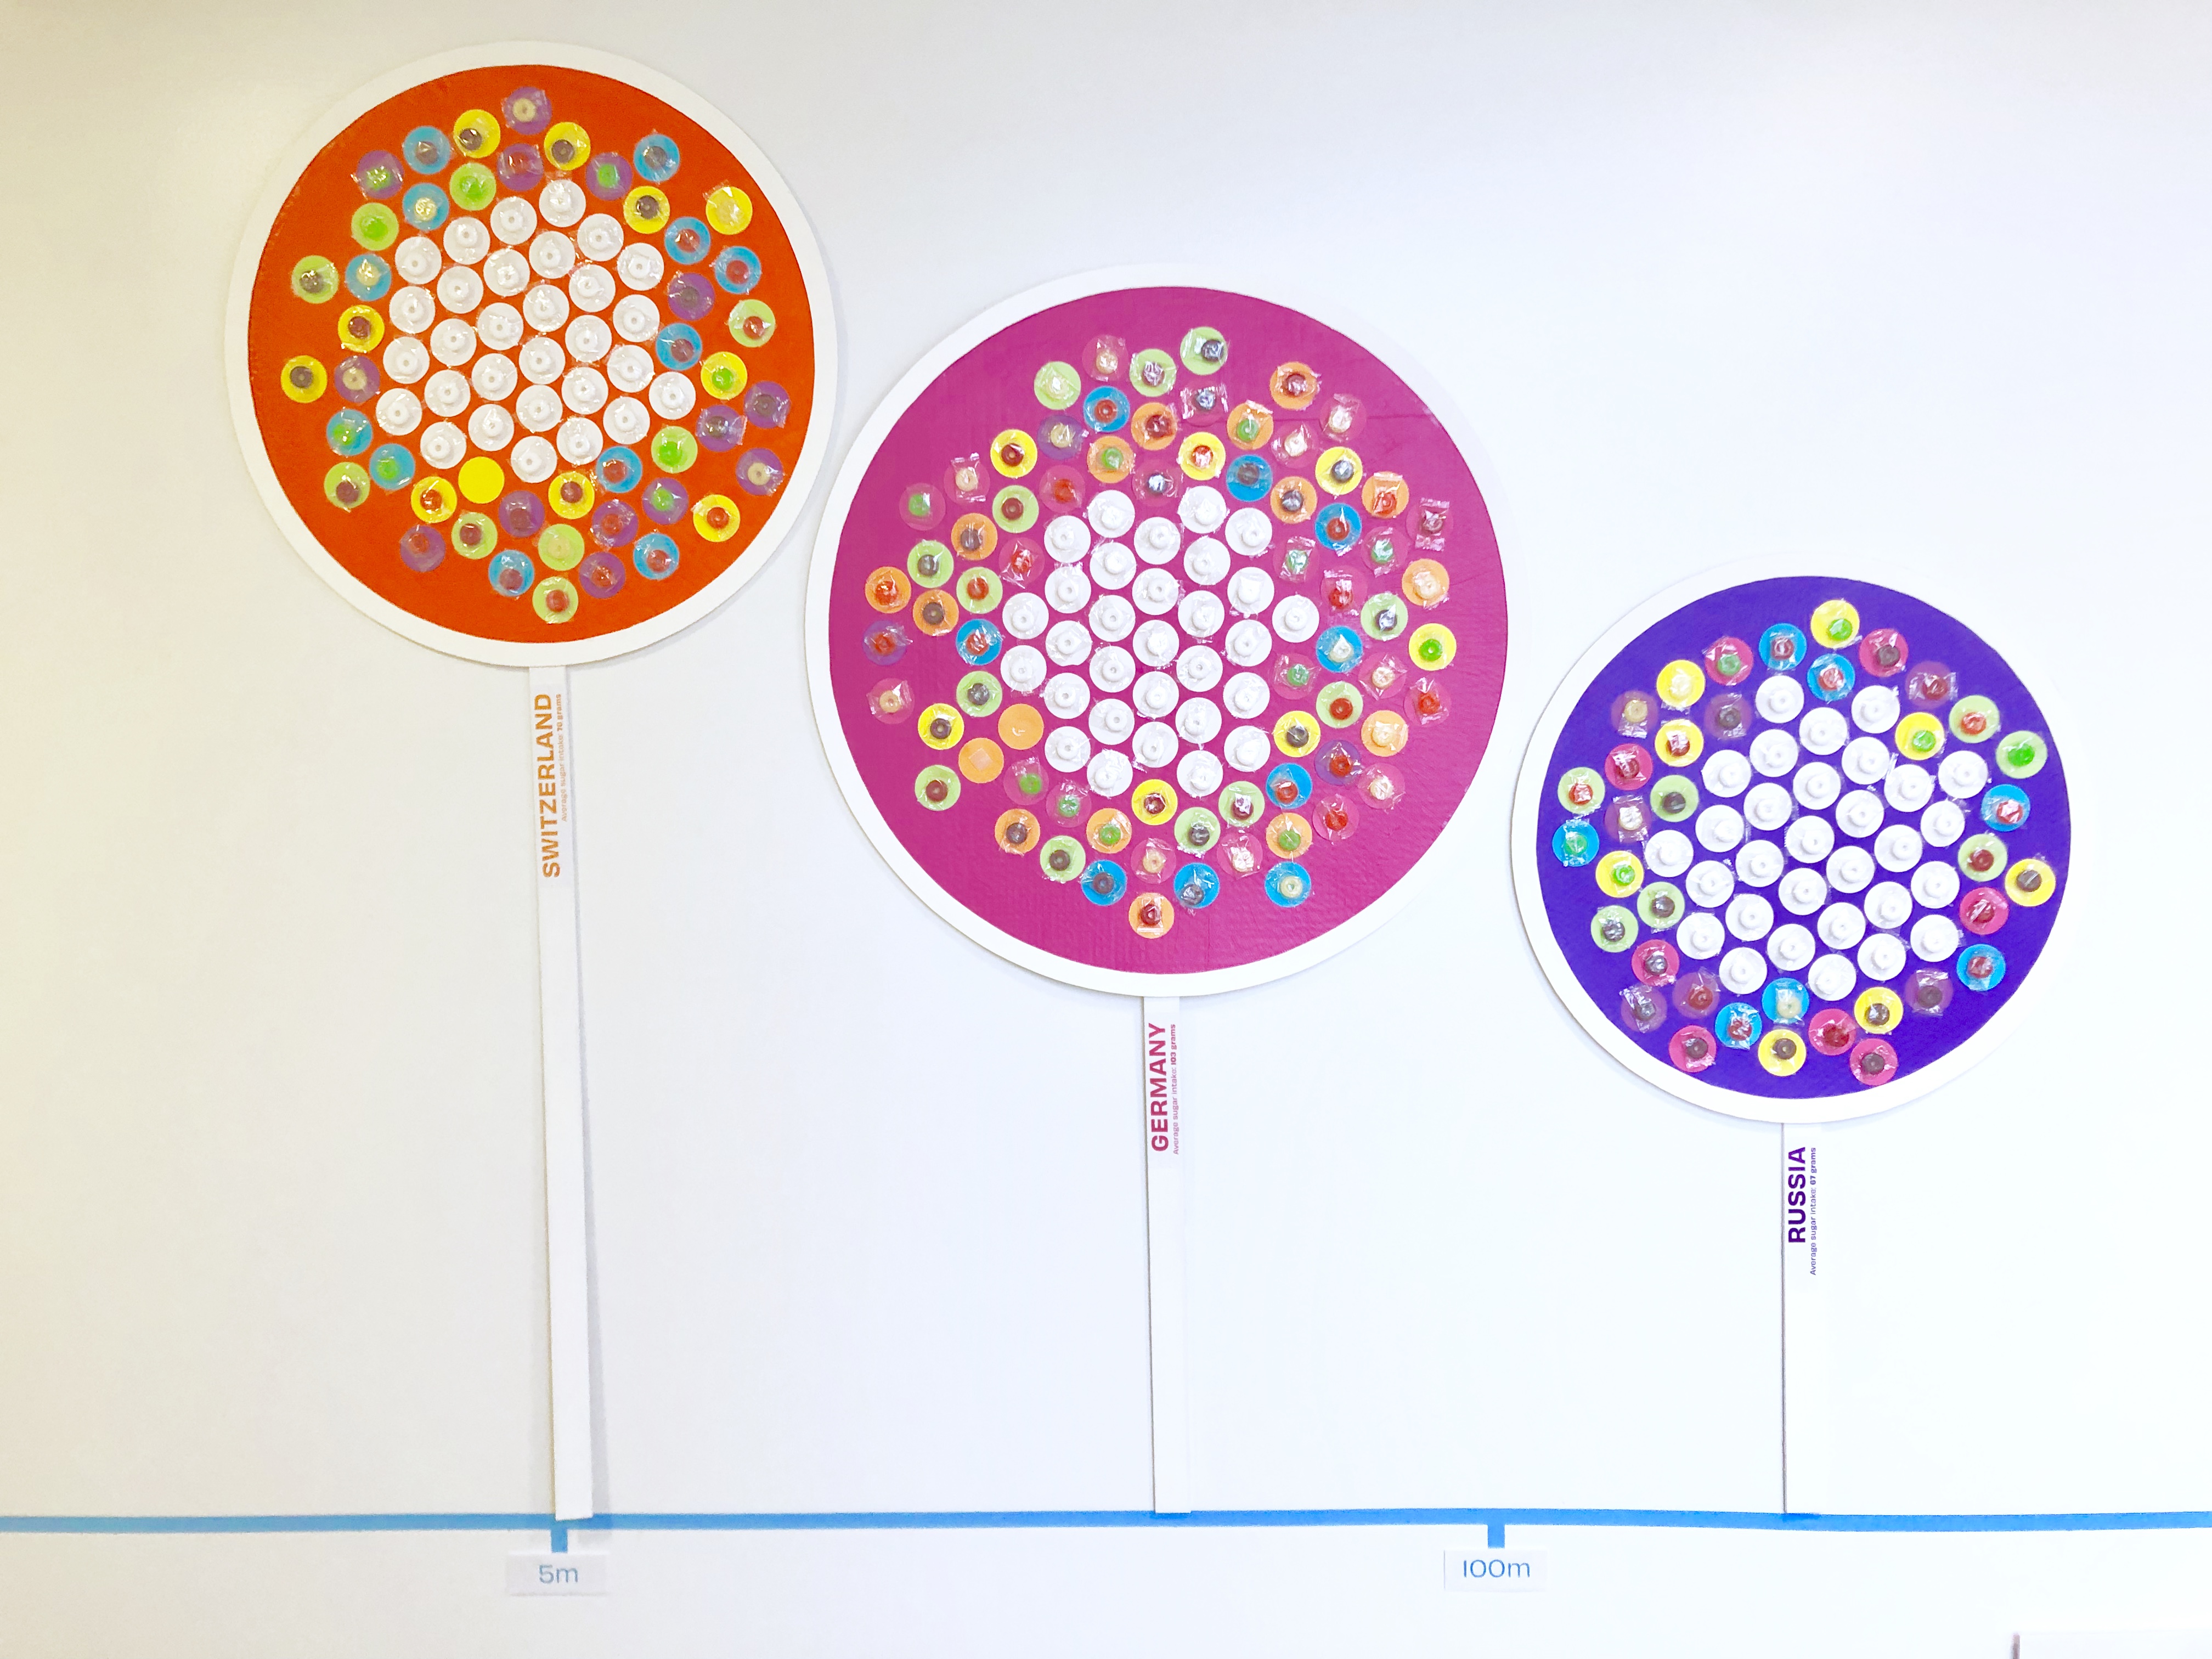
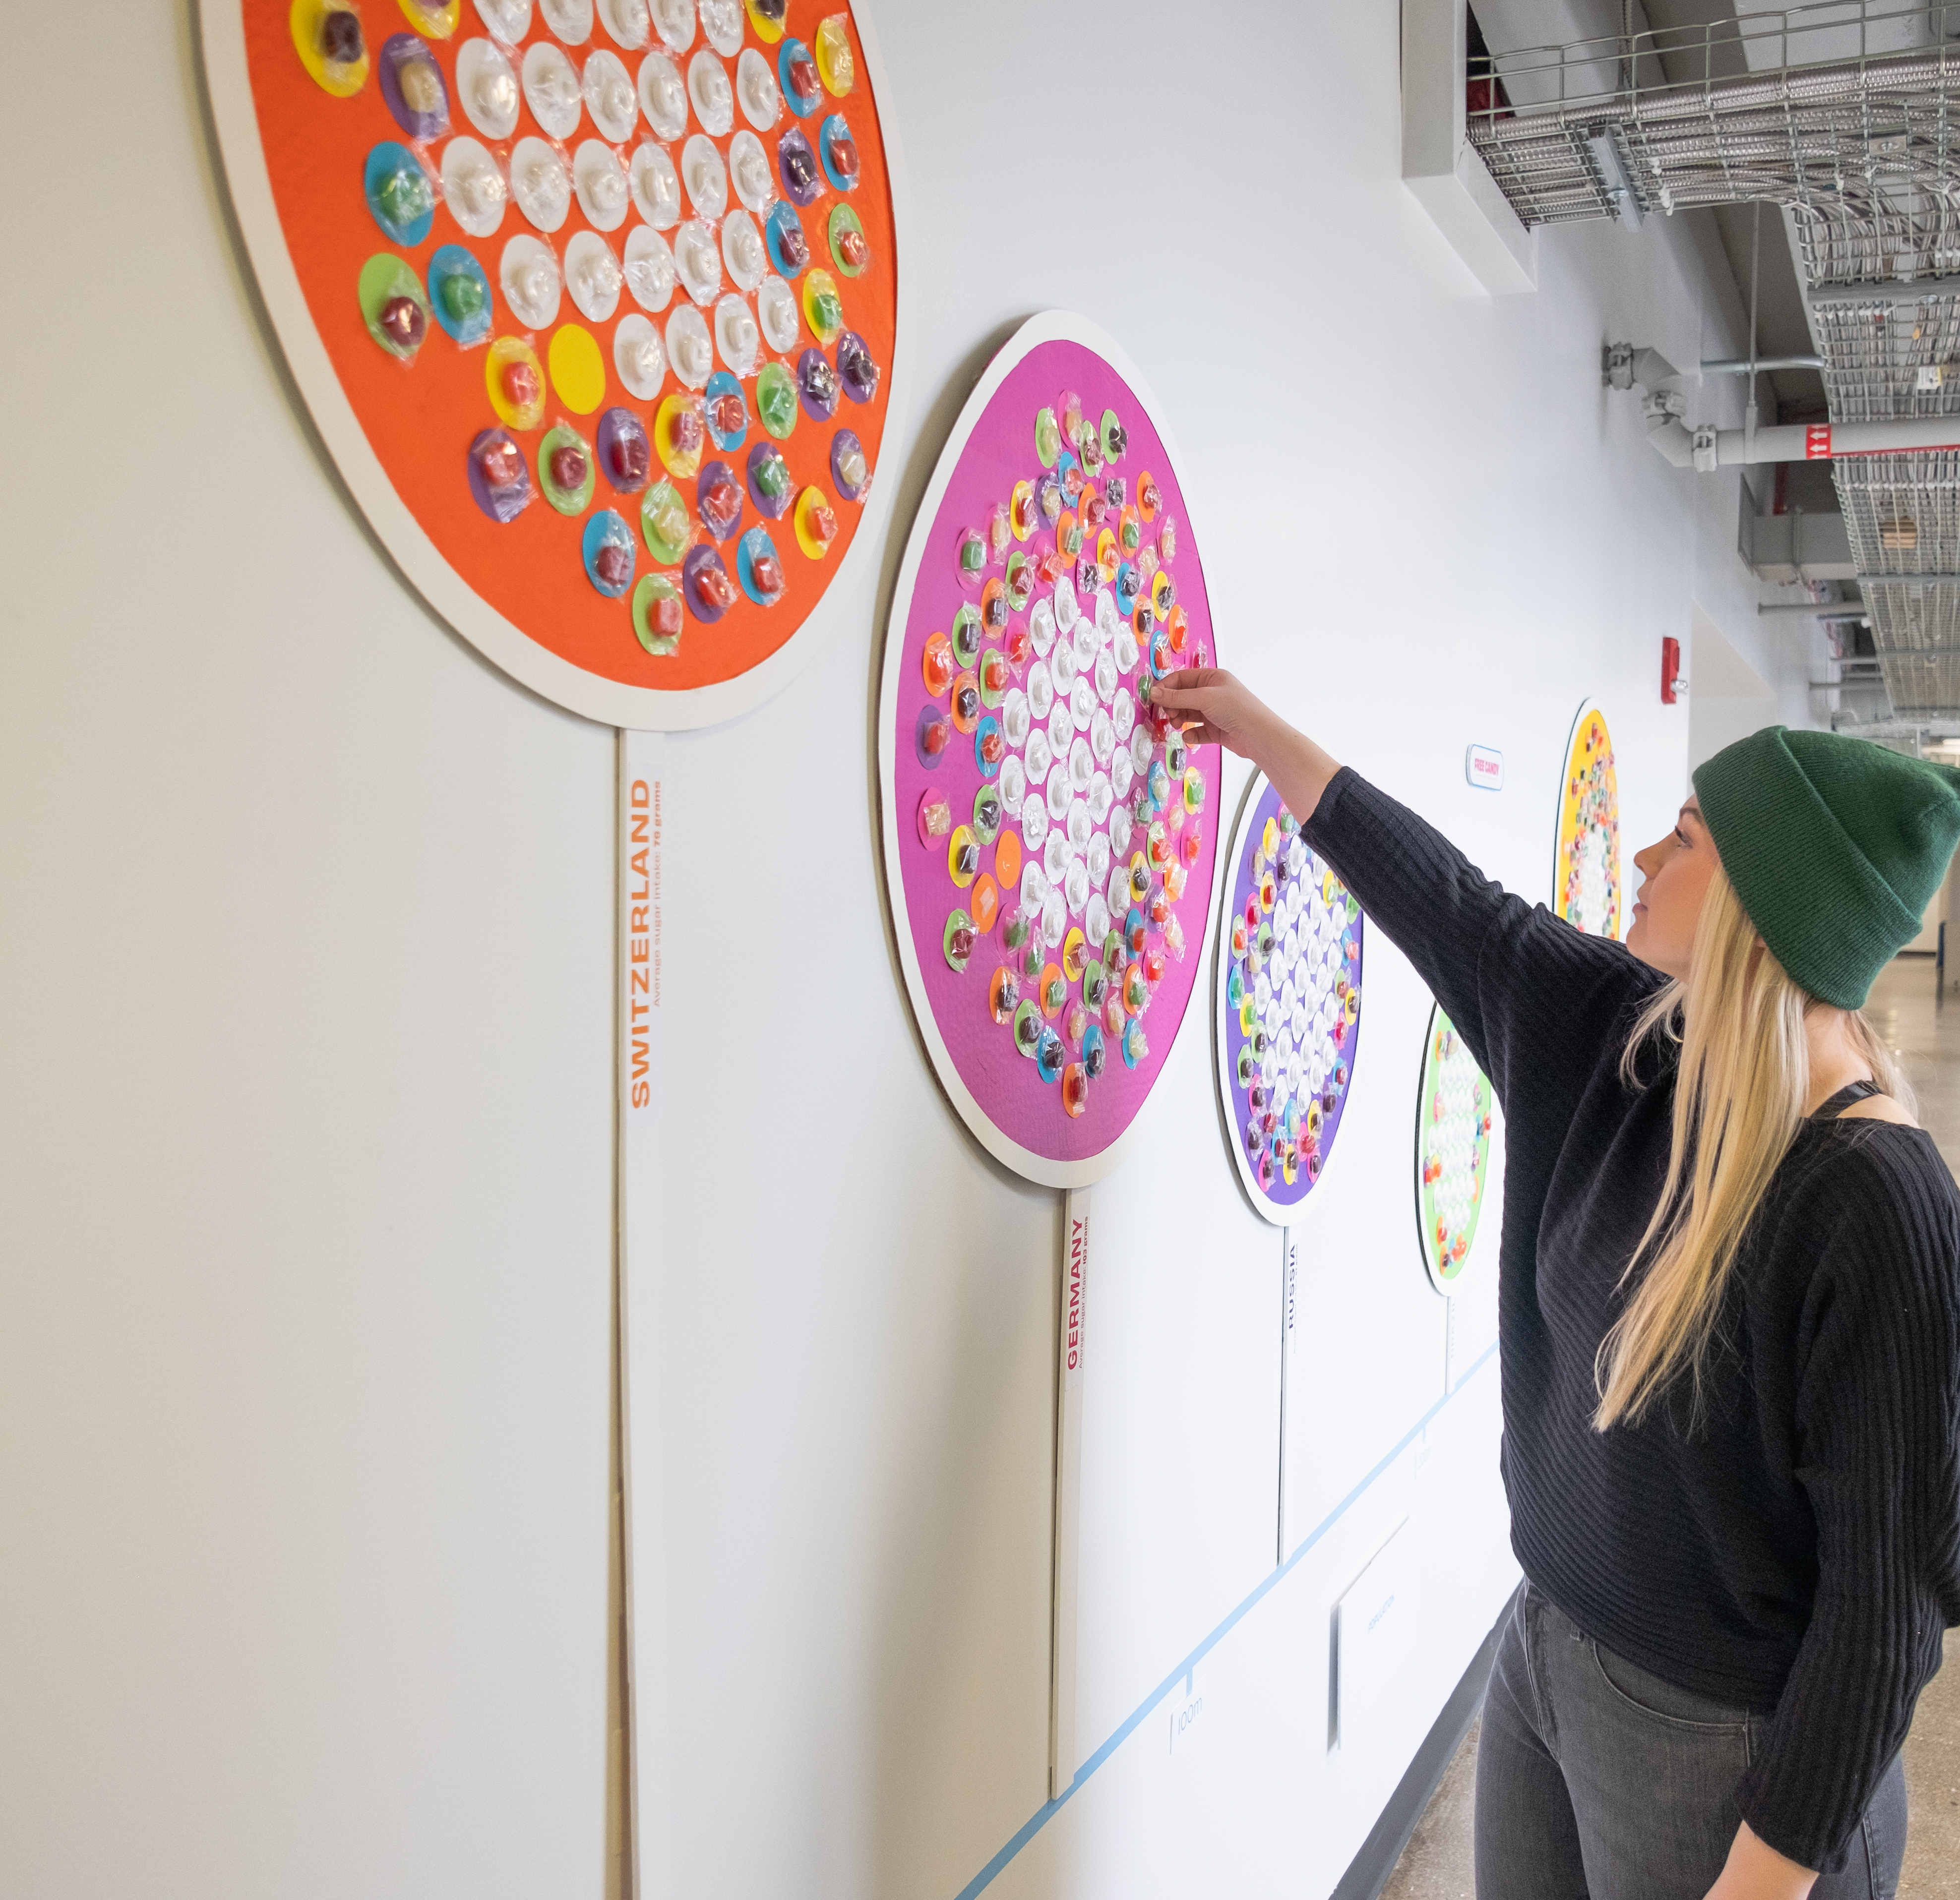
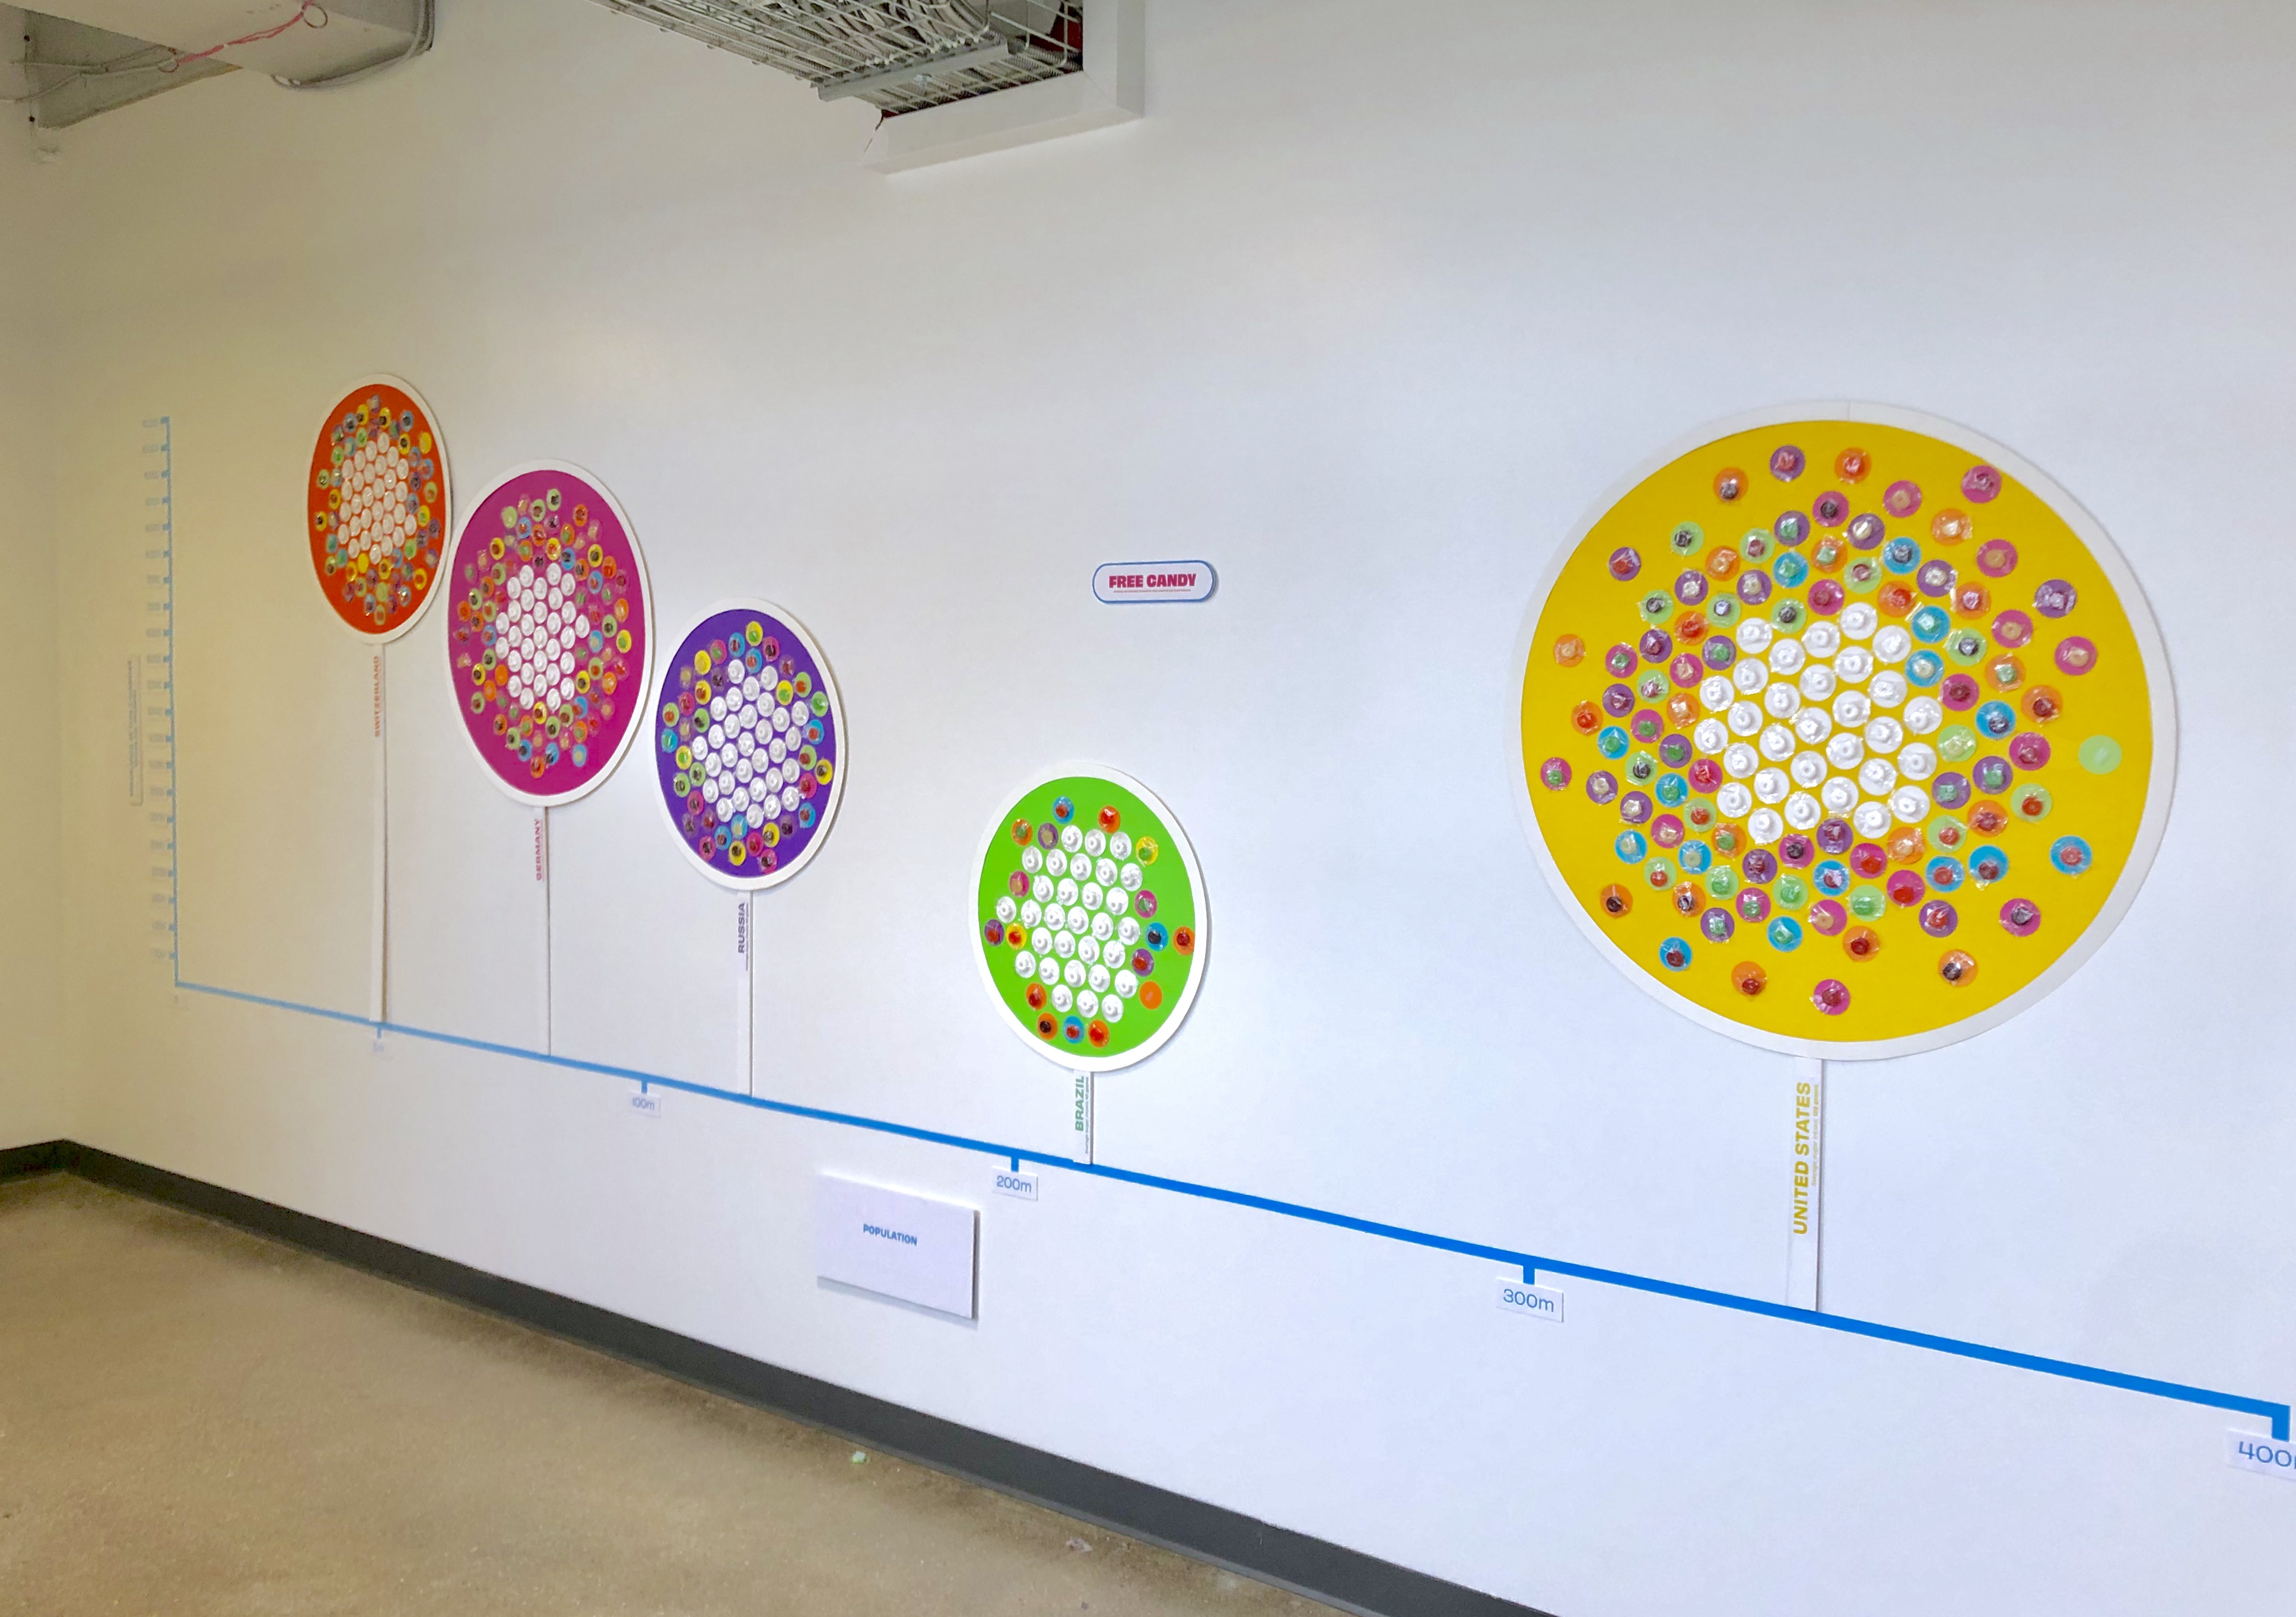
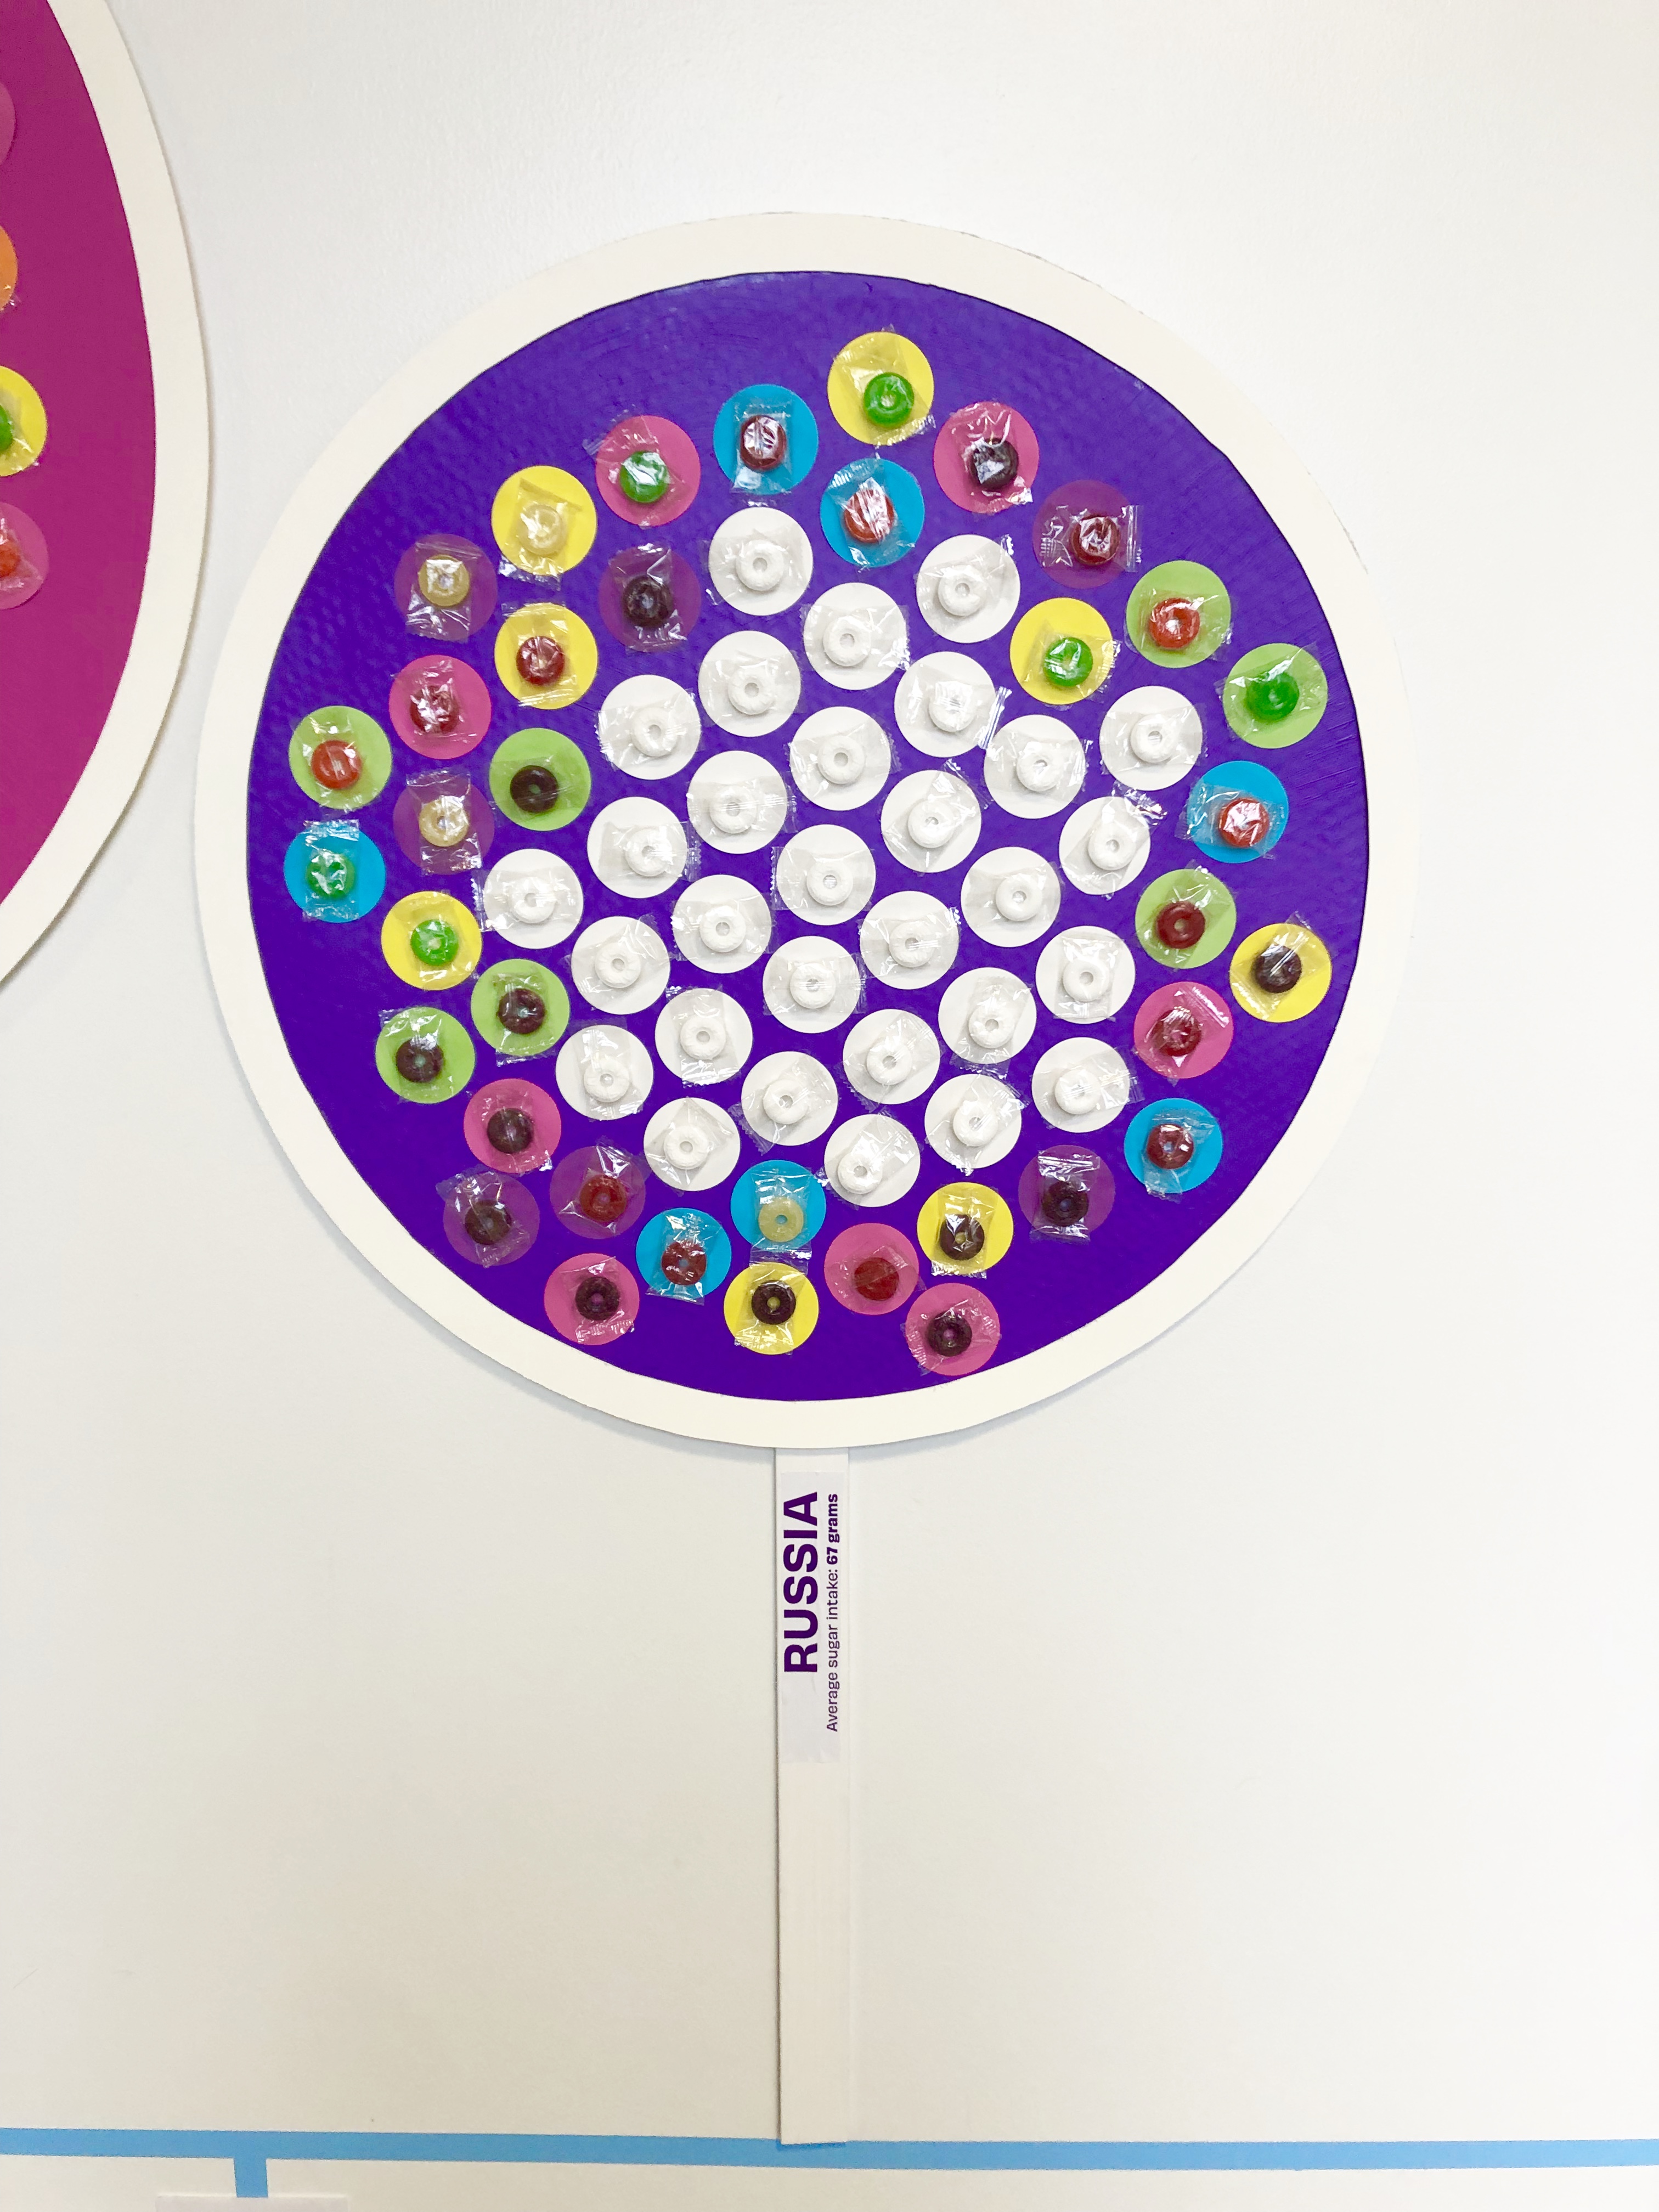
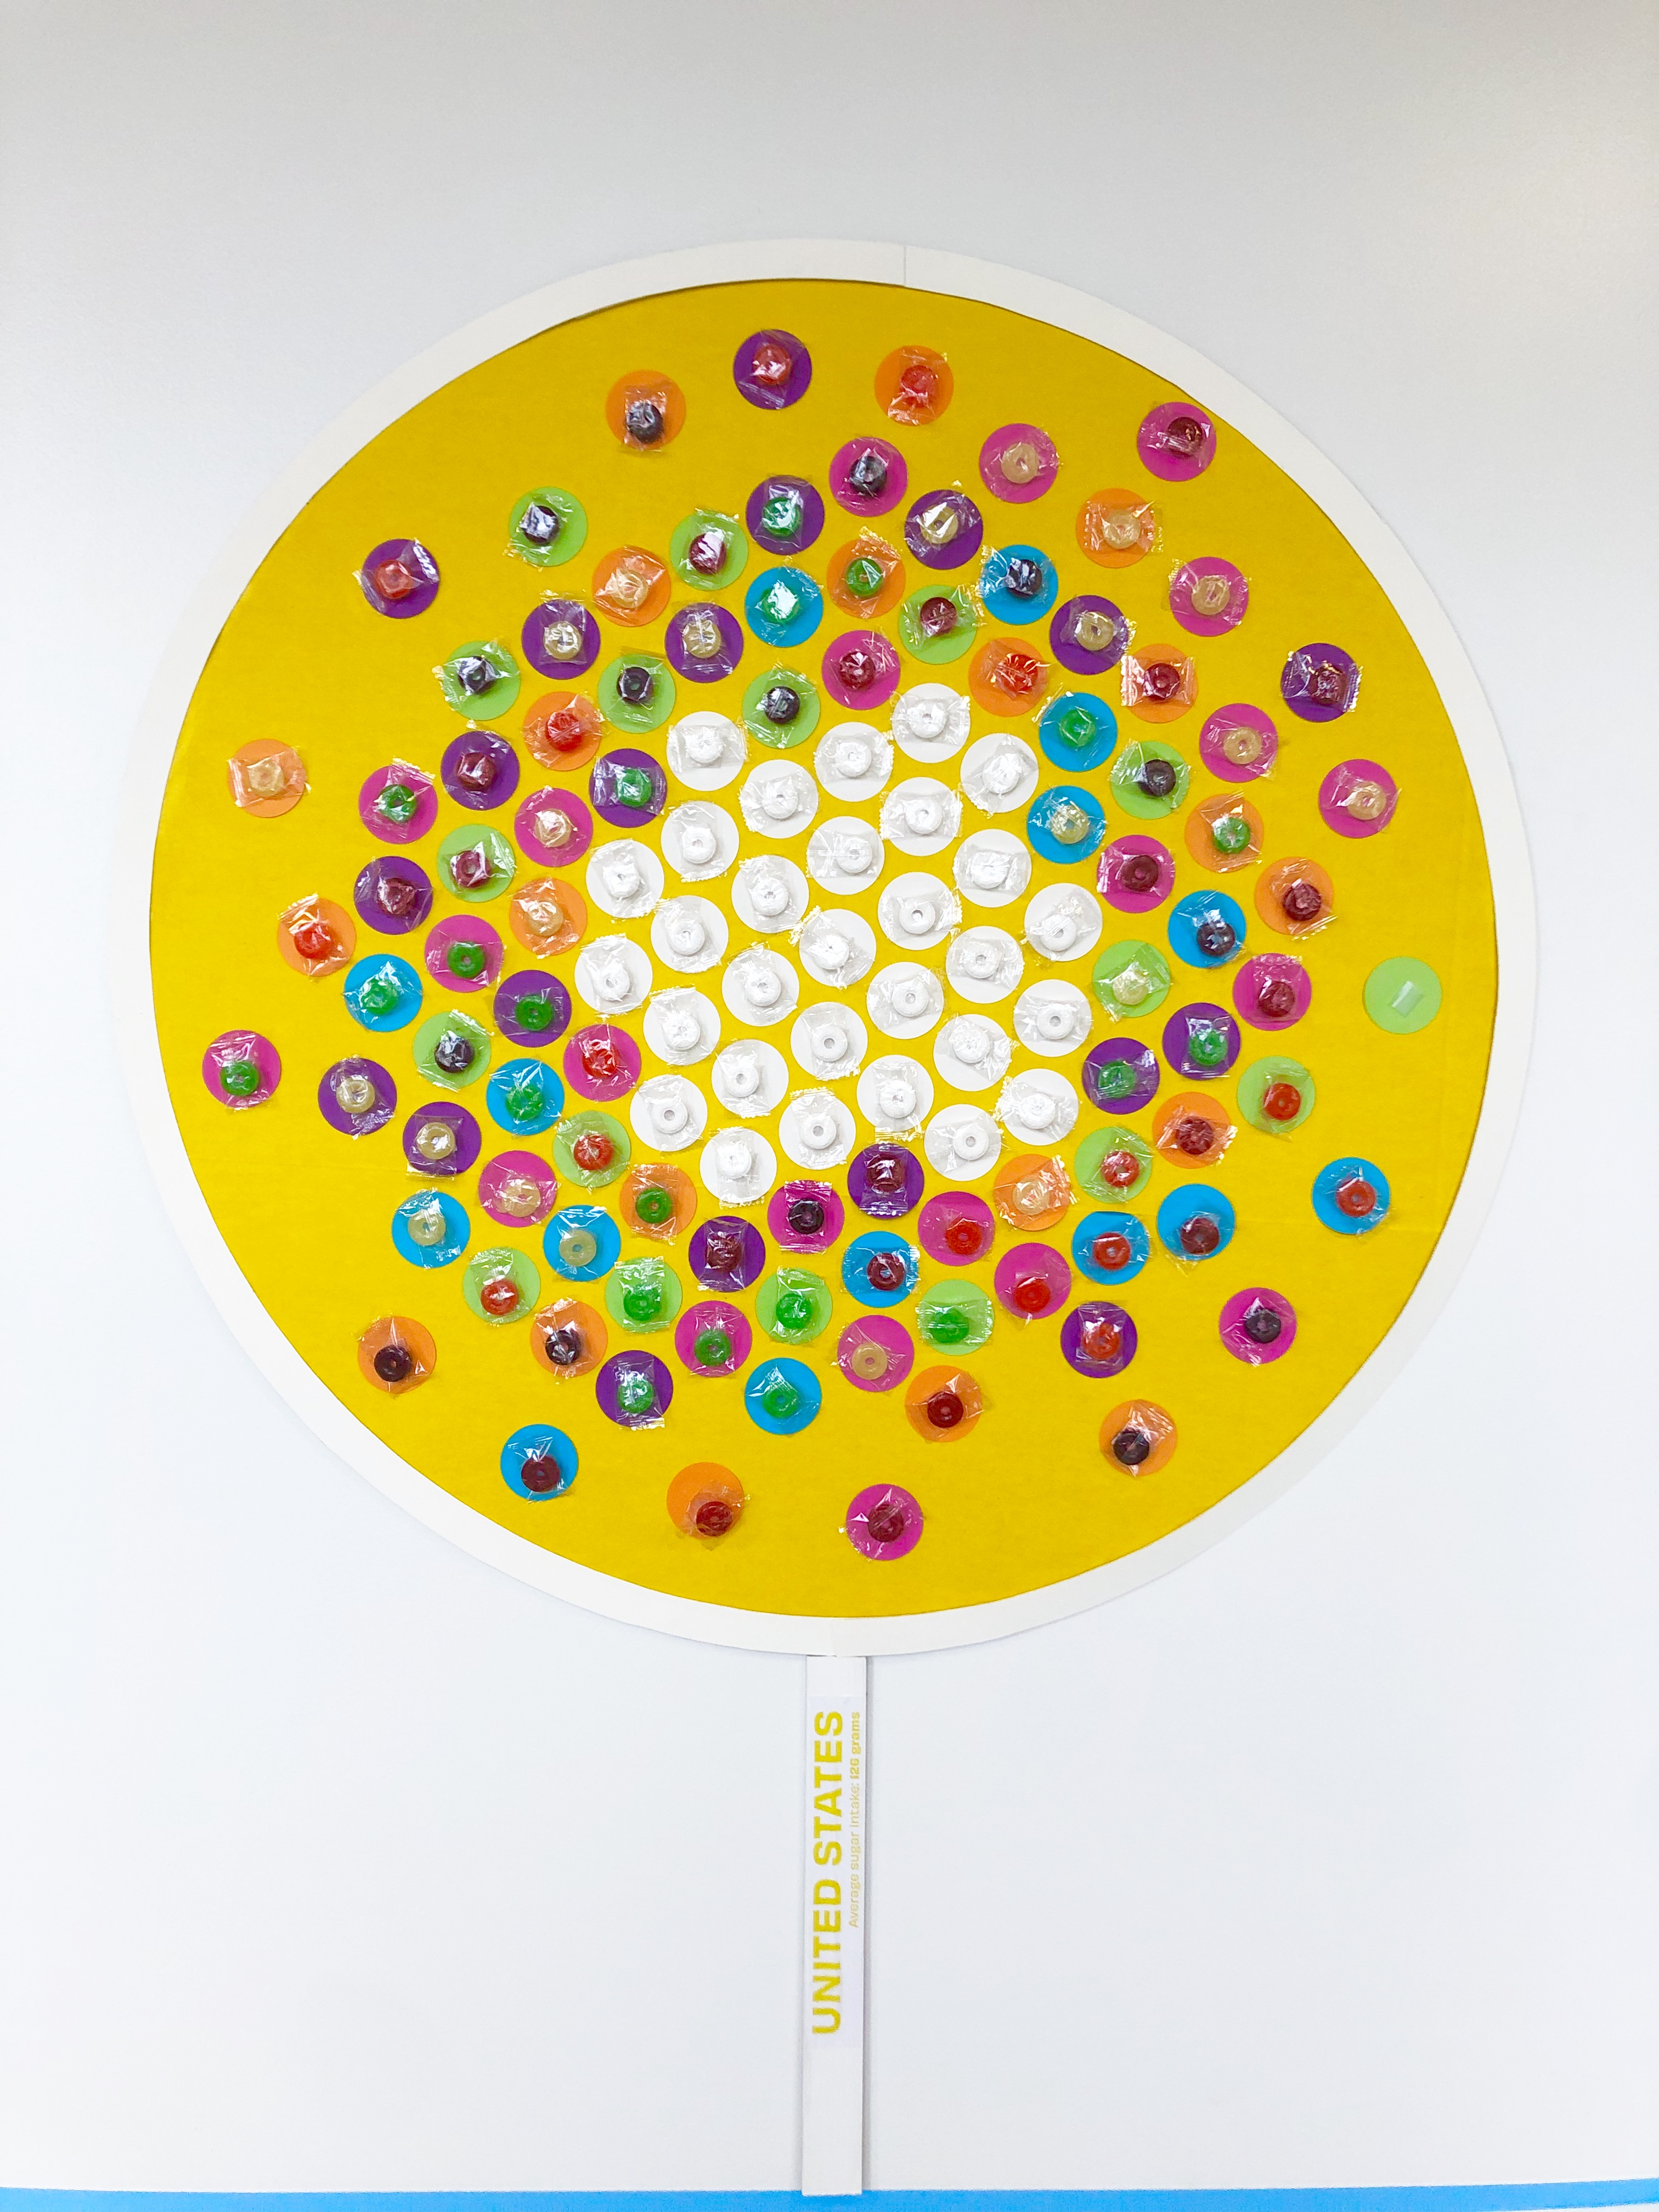
This data visualization shows an overview of five countries’ average sugar intake while also displaying the prevalence of Type 2 Diabetes in cases per 100,000. This large-scale installation shows data in the form of large lollipops and uses candy to represent numbers.
Challenges/Opportunities -
Creating an experience that is impactful for the viewer and shows multiple variables at once without cluttering the experience.
Takeaways -
Throughout the course of this project, I improved my skills in time management and planning out the logistics of a life-size installation.